Software
Symphony Data
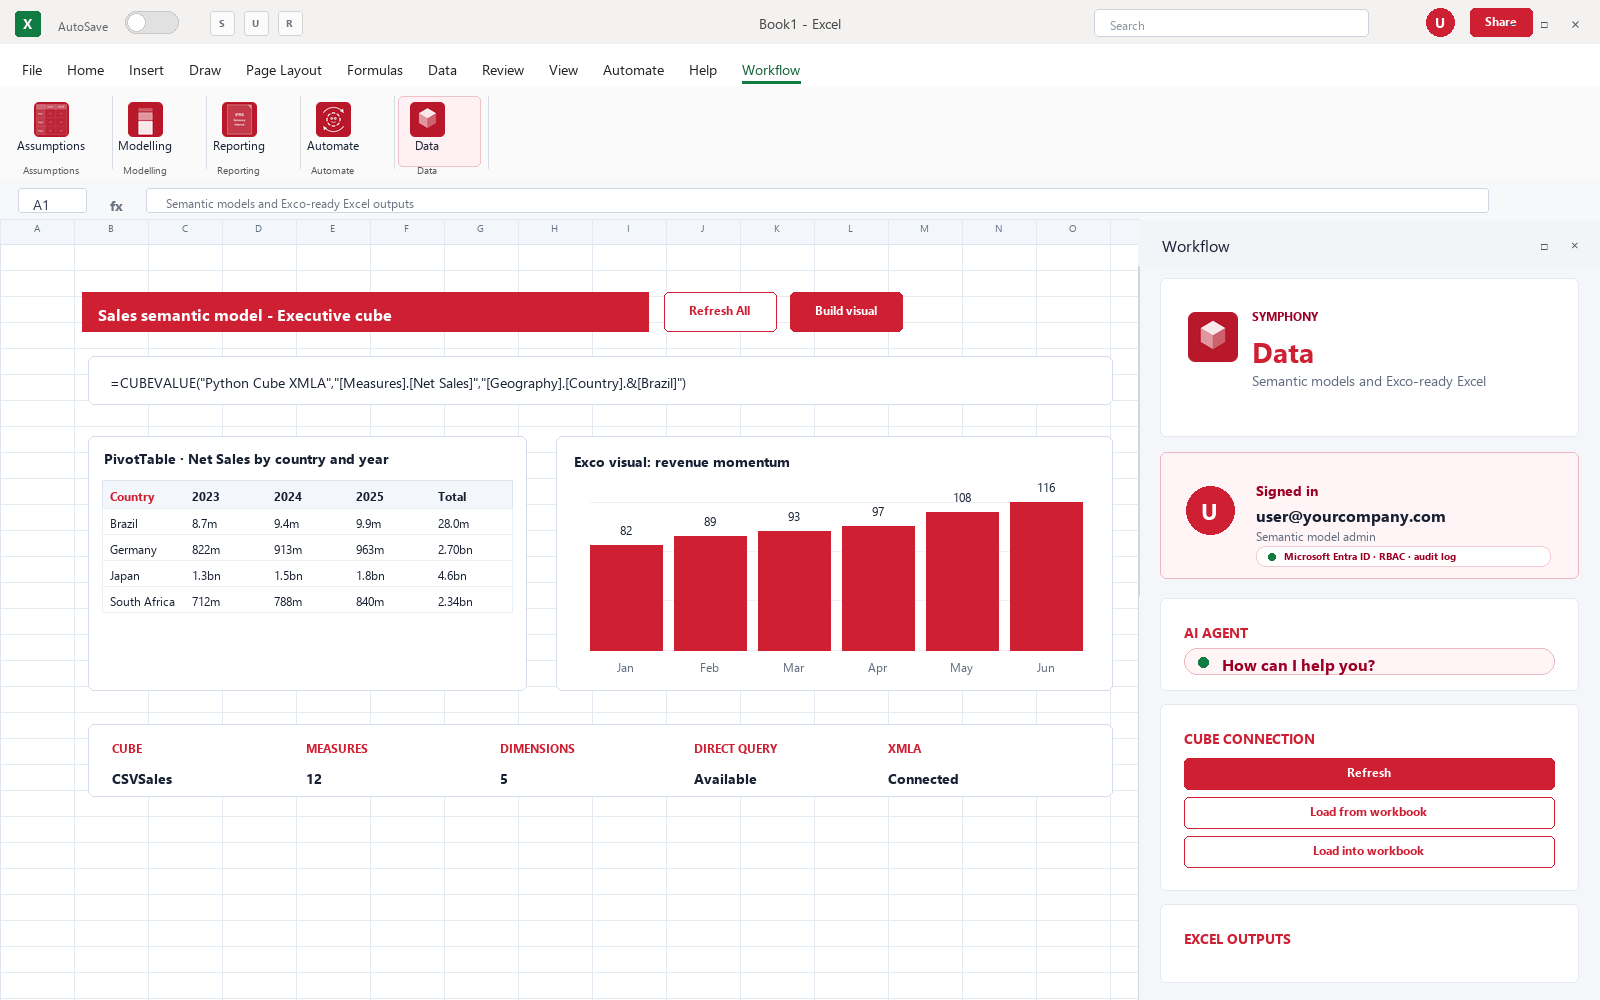
An accelerator component for high-performance multi-dimensional analytics — a governed cube and BI layer over actuarial, finance and risk data — deployed inside an engagement, on your environment.
What it improves
Actuarial and finance teams need to slice large result sets by sub-fund, product, scenario, duration, basis, entity and reporting period — usually all at once, usually in time for tomorrow morning’s meeting. Most BI estates either choke on the volume or drift away from the source-of-truth definitions, and the team ends up rebuilding the answer in Excel.
What it does
- High-performance cube engine sized for actuarial-scale data: sub-fund × product × scenario × duration × basis slicing on large result sets.
- Semantic layer with named, owned business definitions — one metric, one definition, audited.
- Drives Symphony Reporting downstream, and the BI tools you already operate.
- Direct connectivity to the data platforms and warehouses you already operate — no extra ETL hop.
- Designed for sub-second response on the typical actuarial slice, even at portfolio scale.
- Shares the common architecture across the platform: API, lineage, role-based access, observability.
- Available inside Excel, on the web, and via the API — actuaries work in the tool they already know, with full audit trail back to the platform.
In your environment
Real software, in the tool your team already uses.
Controls and audit
Every metric in the cube has a named owner, a written definition and a tested calculation. Lineage runs from the cube cell back to the source. Definitions are version-controlled — revert a metric to any prior definition.
Engagement model
Deployed inside an engagement, on your environment, with documented handover. We do not licence this as a standalone product. In-engagement deployment of a first cube has typically landed inside 6 to 10 weeks on engagements we have run: model the dimensions and metrics with the team, connect to source, validate against the existing definitions, then add cubes — actual timing depends on scope, source-system access and the team’s review capacity. If you want to take the component forward at the end of the engagement, you take it — full source, docs, supported handover.
Want to see it run?
A 30-minute walk-through, with your real reporting questions in mind.